Seasonality 2.0 Module
Seasonality 2.0 is the industry’s most advanced solution for identifying seasonal patterns in Stocks and ETFs.
Profit from the incredible POWER of Seasonality!
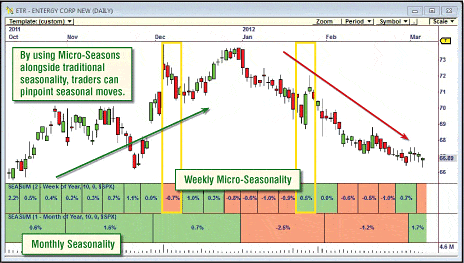
The chart for ETR provides a good example of how stocks can follow a seasonal tendency. The Monthly Seasonality Indicator shows that the stock has historically posted gains in October through December, while it has a tendency to post losses in January and February. You can see how ETR followed this seasonal pattern in the last fi ve months. Seasonality 2.0 allows you to see this tendency in greater detail with Micro-Seasons, as displayed on the Weekly Seasonality Indicator.




NEW Micro-Seasons Unlock Hidden Profits
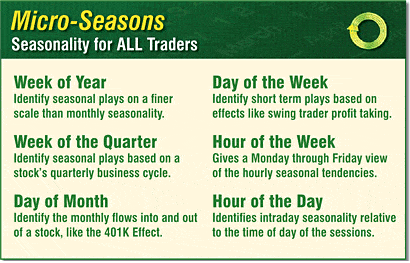
Seasonality 2.0 takes the concept to the next level by applying seasonality to lower timeframes, creating Micro-Seasons! Whether you want to see if a security has a monthly, weekly, daily or even hourly trading tendency, this new feature shows you what a market is poised to do based on historical seasonal behavior. Micro-Seasons let you identify trades that other seasonality software packages miss.
The first version of the Seasonality Module calculated monthly and quarterly seasonal tendencies. This information is extremely valuable, and it is how seasonal analysis has been applied in the past. But with the ability to create your own seasonal boundaries, you can now get an in-depth look into a market’s behavior that is unprecedented.
Swing traders can now use this tool to help time their trades with unprecedented granularity. Intraday traders will love our hourly Micro-Seasons that let you know the best times during a session to trade a given symbol.
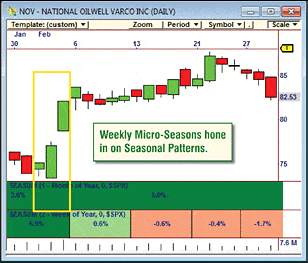
National Oilwell (NOV) shows strong Monthly Seasonality in February. And with Seasonality 2.0’s Micro-Seasons, we see that almost all of it historical gains are realized in the first week of the month. February 2012 followed its weekly seasonal tendency perfectly as NOV made a big gain in the first week of the month.
See Profitable Seasons Right On Your Chart
Determining market seasonality has never been this easy. Seasonality 2.0 puts a chart’s seasonal tendencies at your fingertips, with four new Indicators.
Visualizing the profit potential of seasonality has never been easier.
Pinpoint the Move - with the Seasonality Indicator
Know the Probability - with the Seasonal Direction Indicator
Know the Strength - with the Seasonal Summary Indicator
Confirm the Season - with the Seasonal Correlation Indicator.
Improve the Odds of Every Trade with the NEW Seasonality Block
The Seasonality Block allows you to transform any OmniTrader strategy into a seasonal powerhouse. It works by identifying the signals from your strategy that are aligned with a stock’s seasonal tendencies. By simply dropping this block into your strategy, you will get the most powerful seasonal confirmation available, taking your trading signals to the next level!
INCLUDED: MASTERING Seasonal Trading
Seminar by Jeremy Williams and Angela Duran


In this two-part seminar, Jeremy Williams and Angela Hood introduce you to Nirvana’s new Seasonality 2.0, Module and how to use this powerful tool to its maximum potential. After showing you the basic nuts and bolts of the module, they will show you how to identify profitable seasonal opportunities in stocks and commodities. Learn how to trade earnings reports, monthly patterns, intraday micro-season patterns and master seasonal trading.
Seminar includes: An Introduction to Seasonality
Interface Walkthrough
Performing Seasonal Analyses
Interpreting Seasonal Charts
Using Seasonality in the Focus List
Seasonality Module Features
Seasonality Viewer
Performing Seasonal Analysis
Interpreting Seasonal Charts
Using Seasonality in the Focus List
Seasonality 2.0
$395
Compatible Platform: OmniTrader / VisualTrader
Recommended Data: End Of Day / Real Time
Seasonality is based on the observation that price movement often tends to repeat itself on a seasonal basis, mostly used in the analysis of commodities. Swing and Intra-day traders alike can now use this tool to help time their trades with unprecedented granularity.
Seasonality 2.0 is the industry's most advanced solution for identifying seasonal patterns in Stocks and ETF's.


