Ichimoku Cloud
$495
Compatible Platform: OmniTrader / VisualTrader
Recommended Data: OmniData End-Of-Day
The Ichimoku Cloud is now available for OmniTrader and VisualTrader. Ichimoku (also known as Ichimoku Kinko Hyo) translates to “one glance equilibrium charts”. A “cloud” is formed as a shaded area between the Support and Resistance lines of the Ichimoku indicators.
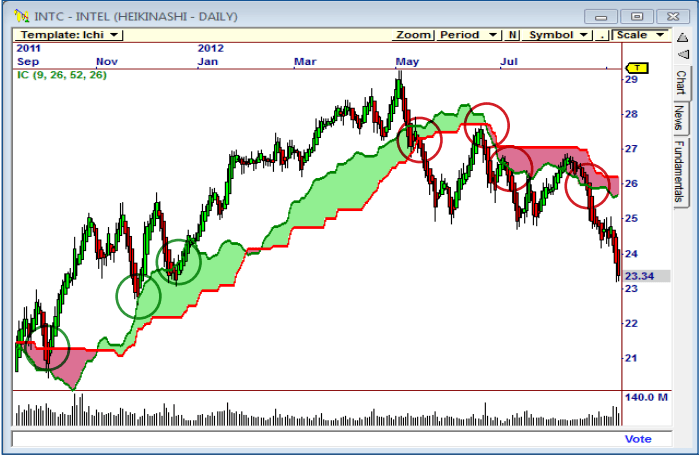
The Ichimoku Cloud Module reveals hidden Support and Resistance levels. As price touches or penetrates the Cloud, entry points are easy to see, as shown in this chart for Intel.
Introducing the Ichimoku Cloud Module
Introducing a new Module that has the promise to forever change the way traders view their charts.
Ichimoku (also known as Ichimoku Kinko Hyo) translates to “one glance equilibrium charts”. A “cloud” is formed as a shaded area between the Support and Resistance lines of the Ichimoku indicators.
These indicators make it very easy to see trend direction and strength, future support and resistance levels, and even price momentum.
Ichimoku Clouds provide a wealth of visual information and have helped traders make profitable trading decisions for decades.
Recently, the Ichimoku Cloud has gained popularity across the globe. Traders are using these tools to trade not only stocks, but commodities, options and forex as well.
With the Ichimoku Cloud Module (ICM), Nirvana Systems has taken these tools and molded them into a powerful new trading package.
Trading with Ichimoku
The Ichimoku approach takes recent price data and plots two main indicators (Leading Span A and Leading Span B) to create a “cloud”. The cloud is then shifted to the right.
Hidden Support and Resistance Revealed!
The visual nature of the cloud can tell us many things. If price is on either side of the cloud, we can instantly see what kind of trend we are in. The thickness of the cloud tells us trend strength. As price approaches the cloud, we will often see the cloud provide support or resistance.
Already you can see that the Ichimoku Cloud provides you with valuable information AND that it is easy to engage.
Additional indicators are included in the Ichimoku Cloud Module to provide even more information. These tools have been used to create three powerful Trading Strategies that present you with great trading candidates right out of the box.
Using Ichimoku Clouds with Heikin-Ashi Charts
Most traders that use Ichimoku Clouds will apply them to Heikin-Ashi charts. The smoothness of the Heikin-Ashi chart coupled with the high impact visual nature of Ichimoku Clouds is a powerful combination.
The ICM Trading Strategies on the next page are configured to be used with Heikin-Ashi charts, which are included in OmniTrader 2014. The two examples to the right show how Heikin-Ashi and Ichimoku Clouds make it easy to identify profitable trading opportunities.
The first example on GM shows a “bounce” off the Cloud. We watch for Heikin-Ashi bars to reach the Cloud and bounce off it, providing a good entry point.
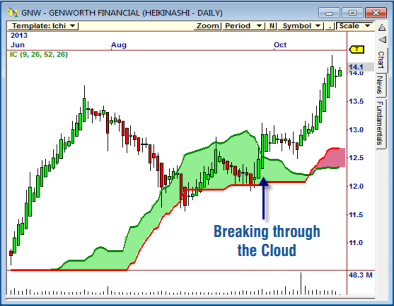
The second chart for GNW shows a break through the top of the Cloud. These “breakout” situations are often very profitable, and are extremely easy to identify when the Cloud Indicator is displayed on the chart
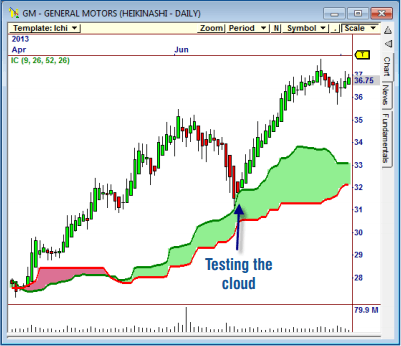


The example above shows the previously strong GM steadily falling in early June. When the Heikin-Ashi chart tests the cloud we spot an excellent entry into the trend.
New Ichimoku Cloud Strategies
Very Accurate Breakout
and Reversal Signals!
The Ichimoku Cloud Module includes three mechanical strategies that were developed to provide you with the most popular Ichimoku Cloud trading setups.
Cloud Bounce Strategy
The ICM Cloud Bounce Strategy looks for price to test the outer boundaries of the Ichimoku Cloud. Since the Cloud often offers support or resistance, this setup provides excellent trend trading opportunities.
Cloud Breakout Strategy
The second strategy is the ICM Cloud Breakout Strategy. This strategy looks for price to push through the top of the Cloud while analyzing the Ichimoku indicators for confirming factors.
Red Cloud Reversal Strategy
The ICM Red Cloud Reversal Strategy will fire long when the cloud is red and price tests the top of the cloud. When this occurs we usually see strong support which leads to good reversal trades.


The ICM Trailing Stop
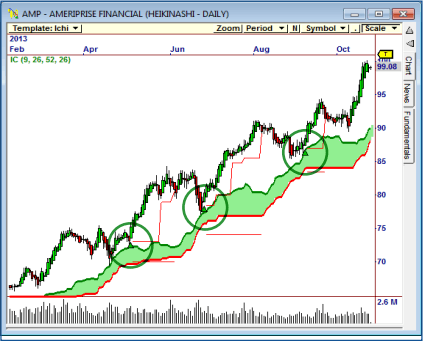
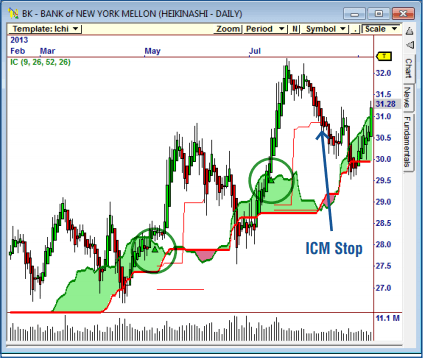
The Ichimoku Cloud Module includes a stop that was specifically designed to be used with Heikin-Ashi charts. The ICM Trailing Stop takes advantage of the smoothness that is inherent in a Heikin-Ashi chart by only updating once a bar prints against the trade.
The charts on page 12 show the ICM stop in action. You will note that the original level of the stop doesn’t change as long the bars advance in the same direction. When an opposite bar prints, the stop will update to the low of that bar with a cushion.
The ICM Trailing Stop does an excellent job of allowing a trade to maximize its gains without exiting too soon. All three of the ICM Trading Strategies use the ICM Trailing Stop.
