Hidden Divergence
$495
Compatible Platform: OmniTrader / VisualTrader
Recommended Data: End Of Day / Real Time
What if you had a Strategy that generated a solid 70% accuracy and produced MONSTER MOVES? That is what Hidden Divergence provides - unlike ANY Trading System we have ever released. In fact, it’s one of the most powerful trading concepts we've have ever seen!
What if you had a Strategy that generated a solid 70% accuracy and produced MONSTER MOVES?
That is what Hidden Divergence provides!
Hidden Divergence is unlike ANY Trading System we have ever released. In fact, it’s one of the most powerful trading concepts we've ever seen!
Every signal in these charts was produced by a Strategy based on Hidden Divergence. Nearly all of them made double digit gains - a result that is common with this technique!
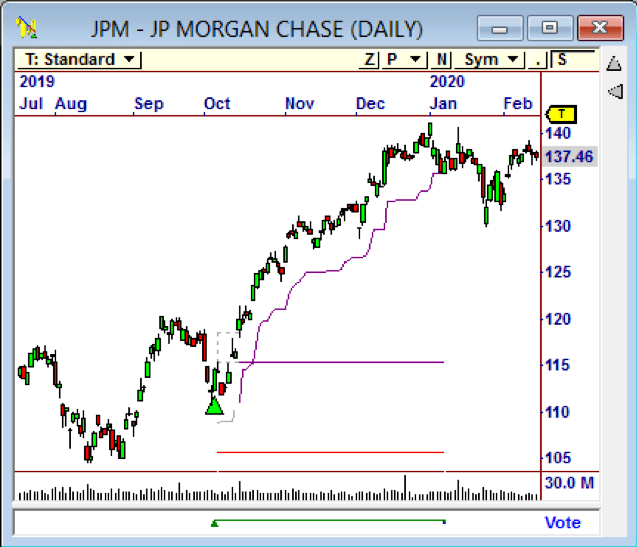

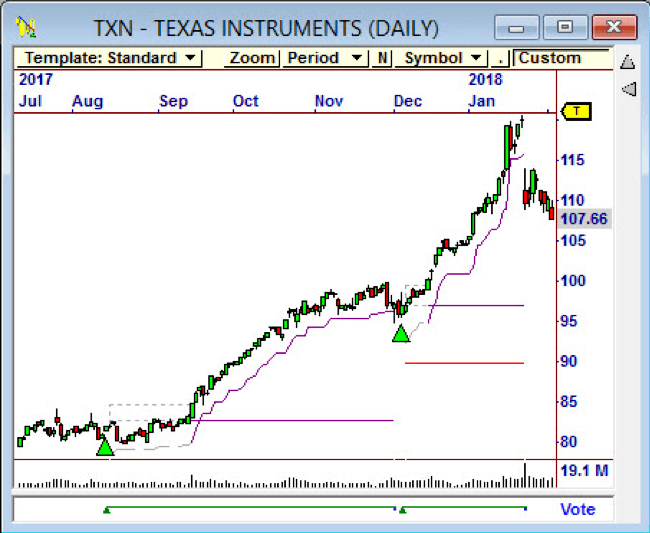

A solid longer term trading approach.
You may already be familiar with REGULAR Divergence, which is great at signaling likely impending Reversals or changes in trend.
HIDDEN Divergence is the perfect companion to Regular Divergence because it identifies Continuation moves with the current trend.
What is Hidden Divergence?
Hidden Divergence is called “hidden” because it is not always obvious – a Strategy that detects the condition is needed so as to find all occurrences. Here is a comparison of the difference between Regular and Hidden Divergence.
Regular Divergence
Indicates a Potential REVERSAL
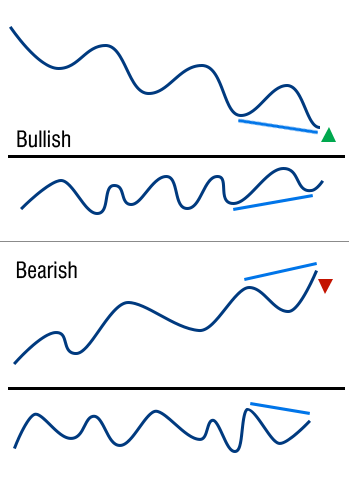

"Regular divergence is the classic interpretation of divergence that occurs when the price action makes higher highs or lower lows while the oscillating indicator does not. This indicates an early warning that the trend could be coming to an end in the near future. Chartists typically use other patterns to confirm the actual reversal."
Hidden Divergence
Indicates a CONTINUATION Move
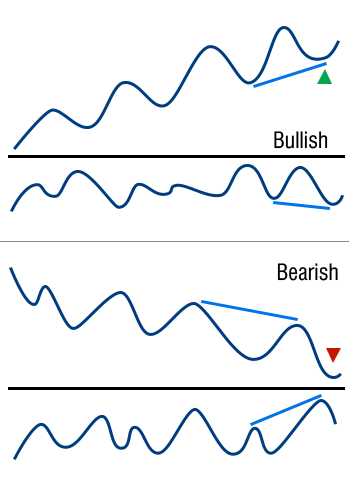

"Hidden divergence occurs when the oscillator makes a higher high or low while the price action does not. This often tends to occur within an existing trend and usually indicates that there is still strength in the prevailing trend and that the trend will resume. In other words, hidden divergence is akin to a continuation pattern. As with regular divergence, hidden divergence can be bullish or bearish."
Image From: www.chart-formations.com
Examples of Hidden Divergence
The image of NVIDIA is an example of bullish hidden divergence. If price makes a higher low, we are trending upward. But if the indicator we are analyzing the security with makes a lower low, we have “hidden” divergence.
So what this tells us is that price is trending upward with a higher low pivot, but it has either temporarily lost momentum or it is oversold in the recent market. This provides us with an exceptional entry opportunity into the primary trend.
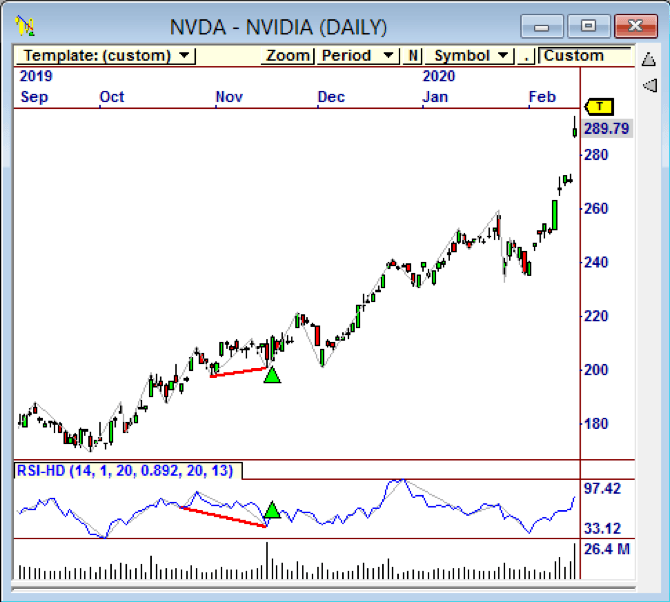

Bullish Divergence on NVDA Leading a
Strong Continuation Move.
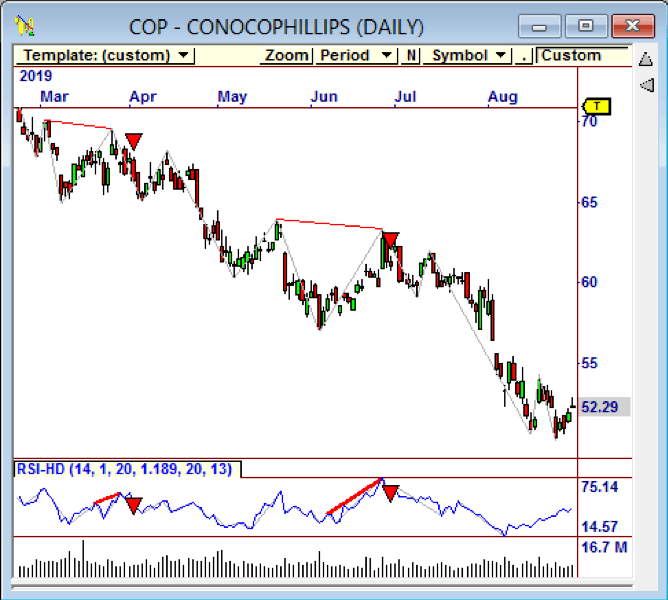

Two Examples of Powerful Bearish Hidden Divergence on COP.
Our researchers applied this concept to some of our favorite momentum indicators, and we were pleasantly surprised at how well hidden divergence found trend continuation opportunities.
With some more research, we were able to develop a suite of excellent Trading Strategies that are perfectly suited to the current market, as explained on the next page.
The new Hidden Divergence Strategies will produce stellar trading opportunities you wouldn’t see otherwise.
Included: 5 Great Hidden Divergence Strategies!
The Hidden Divergence Module Includes five superb Trading Strategies, each designed to find optimal entries in an established upward trending market. Each Strategy uses a different Momentum Indicator to find concurrent pivot divergence relative to price.
▲ Balance of Power
▲ De-trended Price
▲ Momentum
▲ Rate of Change
▲ Relative Strength
The slight differences in each indicator assures us that we are finding all of the best hidden divergence trades in the current market.
Two examples are shown on this page, demonstrating the excellent trend-following quality of the Signals and Exits (more examples are presented on the next page).
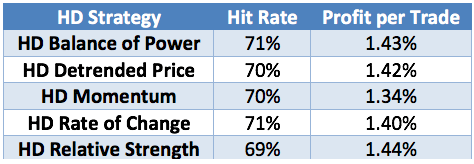
Each Strategy has shown excellent performance over the last decade, with all about 70% profitable and over 1% PPT as shown in the table.

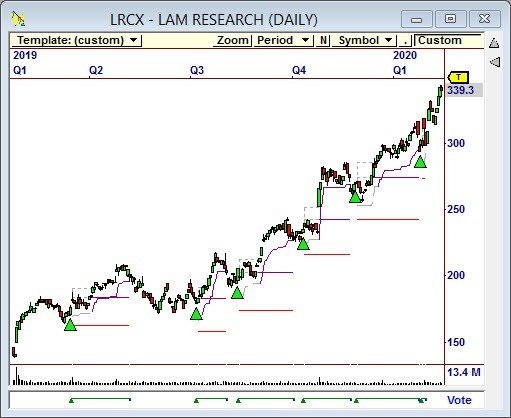

Signals generated by the HDM Strategies.
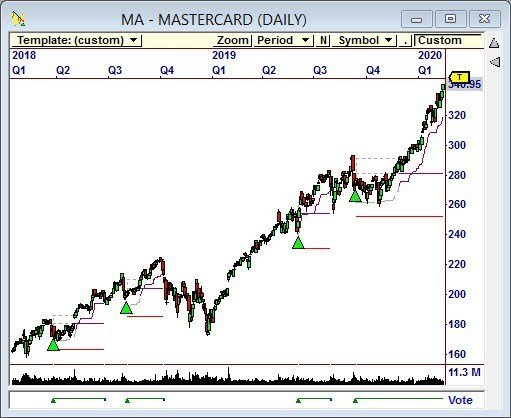

More great Signal from the Hidden Divergence Module.
More Hidden Divergence Signal Examples
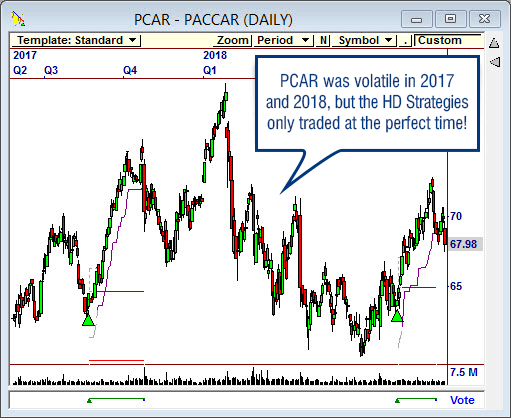

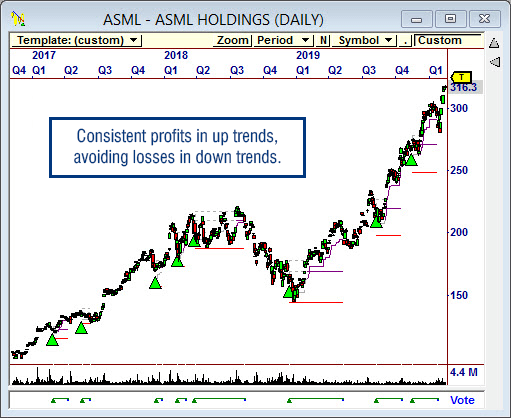

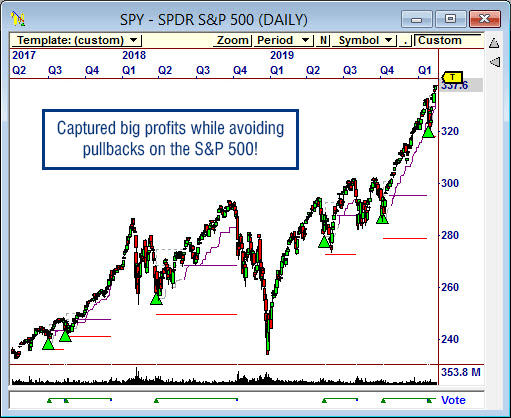

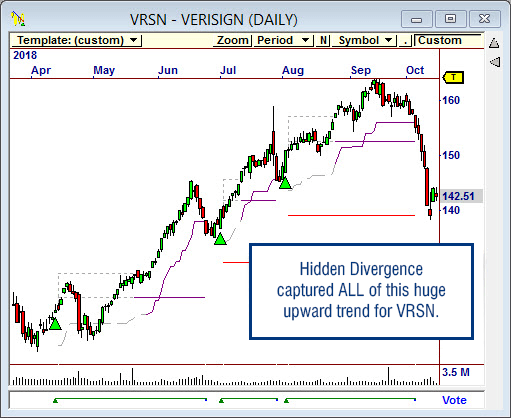

Profitable Technique Using The Hidden Divergence Module!
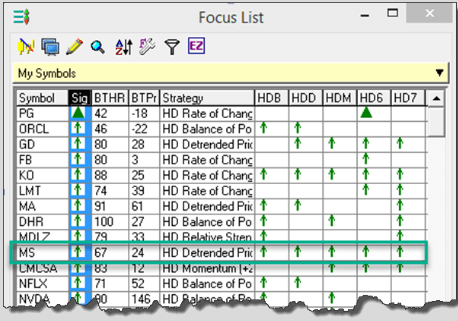
We are finding that when multiple Hidden Divergence Strategies align, a strong move often follows. Use the column feature of the Focus List to easily see it each day! Plus, you will see ALL HD Signals so you don’t miss one if it's not on the Vote Line.

Important Information: Futures, options and securities trading has risk of loss and may not be suitable for all persons. No Strategy can guarantee profits or freedom from loss. Past results are not necessarily indicative of future results. These results are based on simulated or hypothetical performance results that have certain inherent limitations. Unlike an actual performance record, simulated results do not represent actual trading. There are numerous market factors, including liquidity, which cannot be fully accounted for in the preparation of hypothetical performance results all of which can adversely affect actual trading results. No representation is being made that any account will or is likely to achieve profits or losses similar to these being shown.


